Guidelines' are always help people to ensure if they made necessary checks before going deep dive.
If your team faces the same issue more than several times, it's good to keep it recorded. So, next time, your response time will be significantly shorter. That leads happy customers 🥳
In this post you can find a guideline to determine the underlying issue when there is an issue with a pod.
Check if cluster is healthy
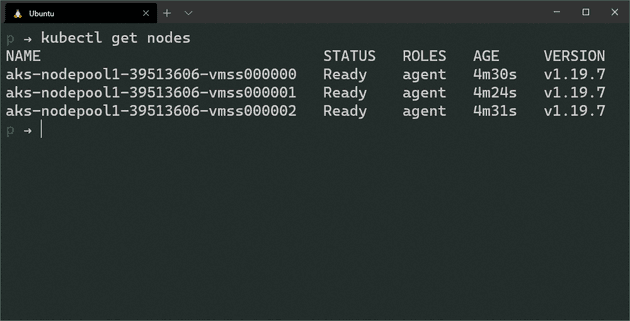
First thing first, let's check if the nodes are healthy. Run the following command and wait to see if all the nodes are in Ready status;
kubectl get nodesIf some of the nodes are not in the Ready status, that means those nodes (or VMs if you will) are not healthy.
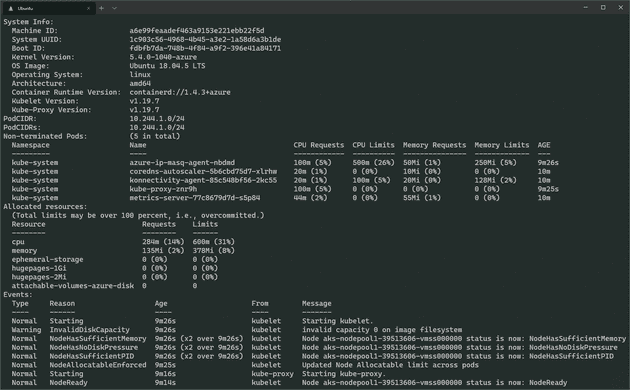
You can find the issue that causes the node to fail, by executing the following command;
kubectl describe node <NODE_NAME>If nodes are Ready, check the logs, by executing the following commands;
# On Master node
cat /var/log/kube-apiserver.log # Display API Server logs
cat /var/log/kube-scheduler.log # Display Scheduler logs
cat /var/log/kube-controller-manager.log # Display Replication Manager logs

# On Worker nodes
cat /var/log/kubelet.log # Display Kubelet logs
cat /var/log/kube-proxy.log # Display KubeProxy logs
If nodes are healthy, continue with checking pods;
Check if pods are healthy
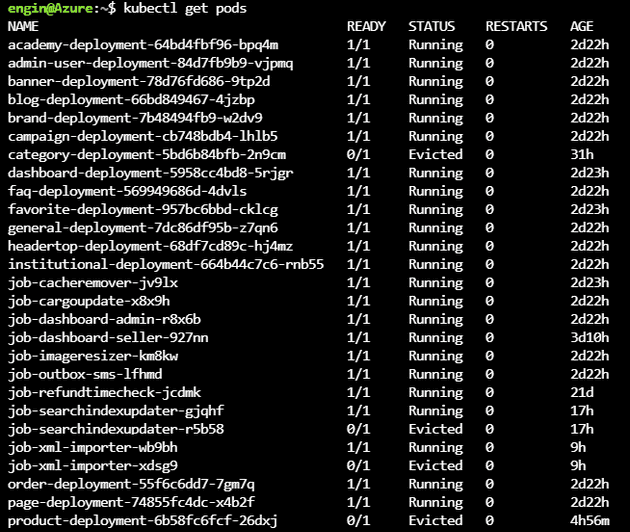
Let's list the pods;
kubectl get podsIf you're seeing some pods are not in Running state, that means, we need to focus on those pods.
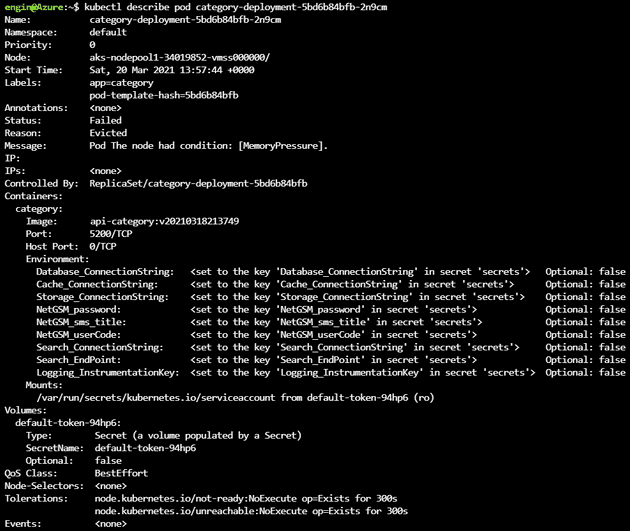
Let's run the following command to see if there is a metadata issue;
kubectl describe pod <POD_NAME>Check the Status, Reason and Message fields first.
In the below example, we can clearly see that nodes doesn't have enough memory to run the pod.
Eviction Reasons
- MemoryPressure: Available memory on the node has satisfied an eviction threshold
- DiskPressure: Available disk space and inodes on either the node's root filesystem or image filesystem has satisfied an eviction threshold
- PIDPressure: Available processes identifiers on the (Linux) node has fallen below an eviction threshold
If there is no issue with the Status, Reason and Message fields, check the Image field.
Check Pod Image is correct
Somehow, your CI/CD Pipeline may not be able to push the new image to the Container Registry, but update the Kubernetes Pod Metadata, so, Kubernetes cannot fetch the new image and ...will fail.
If the image data is correct, check the integrity of Pod Metadata
Check Pod Metadata Integrity
Since the pod is not running properly, let's delete it safely and validate the Pod Metadata first, by executing the following command;
kubectl apply --validate -f deploy.yamlIf there is an issue with the metadata, --validate option detects the issue before applying it to the Kubernetes.
If everything up to this point is fine, that means, pod is running, it's time to check the logs
Check Logs of the Running Pod
Run the following command to check the logs of the running pod;
kubectl get pods

kubectl logs <POD_NAME>
If you don't spot any issue with the logs of the pod, connect to the pod and check the system in the pod;
Connect to a Shell in the Container
To get a shell to the running container, execute the running command;
kubectl exec -ti <POD_NAME> -- bashIf the running pod doesn't have bash, use sh instead of bash, use the following command;
kubectl exec -ti <POD_NAME> -- sh


